6-year-old Tuesday Muse raised money for Japan with her artwork, and now she's totally excited to be in the Name of the Year competition. But she's in a tough match against Joe Shortsleeve. Why not help her out? Vote Tuesday Muse for Name of the Year!
NOTY has a strong ballot of 64 names this year — including Yolanda Supersad, Dr. Loveday Conquest, Courvoisier Winetavius Richardson, and Mercedes Bunz, who, some readers of this blog may be interested to note, has penned a history of the Internet.
"It is immediate from the definition that a given classical watch may have several extensions into a mustard watch, whereas given a mustard watch W' there is only one underlying classical watch W from which W' is derived." (via Jeff Erickson)
I use gnuplot for nearly all my graph-drawing for academic publications. On the whole, it's clean and relatively flexible, and that combined with inertia has been enough to keep me from trying interesting alternatives like matplotlib, Plot, ploticus, and R. However, gnuplot's default output is not especially pretty. I often see graphs in papers that look like this...
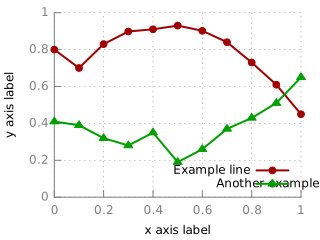
...or worse, if it's been bitmapped rather than using EPS or PDF. With some tweaking, however, one can produce much more attractive output. I would much rather look at plots like this:
In fact it looks better. Blogger doesn't seem to support any vector image format, but here are the pdf version and the svg version. To produce the PDF version, you need gnuplot 4.4's pdfcairo terminal. Below, you can see the gnuplot files for the above two plots.
set terminal postscript eps color

set output "boring_default.eps"
set xlabel "x axis label"
set ylabel "y axis label"

set key bottom right

set xrange [0:1]
set yrange [0:1]

plot "template.dat" \
   index 0 title "Example line" w lp, \
"" index 1 title "Another example" w lp
# Note you need gnuplot 4.4 for the pdfcairo terminal.

set terminal pdfcairo font "Gill Sans,9" linewidth 4 rounded fontscale 1.0

# Line style for axes
set style line 80 lt rgb "#808080"

# Line style for grid
set style line 81 lt 0  # dashed
set style line 81 lt rgb "#808080"  # grey

set grid back linestyle 81
set border 3 back linestyle 80 # Remove border on top and right.  These
             # borders are useless and make it harder
             # to see plotted lines near the border.
    # Also, put it in grey; no need for so much emphasis on a border.
set xtics nomirror
set ytics nomirror

#set log x
#set mxtics 10    # Makes logscale look good.

# Line styles: try to pick pleasing colors, rather
# than strictly primary colors or hard-to-see colors
# like gnuplot's default yellow.  Make the lines thick
# so they're easy to see in small plots in papers.
set style line 1 lt rgb "#A00000" lw 2 pt 1
set style line 2 lt rgb "#00A000" lw 2 pt 6
set style line 3 lt rgb "#5060D0" lw 2 pt 2
set style line 4 lt rgb "#F25900" lw 2 pt 9

set output "template.pdf"
set xlabel "x axis label"
set ylabel "y axis label"

set key bottom right

set xrange [0:1]
set yrange [0:1]

plot "template.dat" \
   index 0 title "Example line" w lp ls 1, \
"" index 1 title "Another example" w lp ls 2
set terminal svg size 320,240 fname "Gill Sans" fsize 9 rounded dashed

# Line style for axes
set style line 80 lt 0
set style line 80 lt rgb "#808080"

# Line style for grid
set style line 81 lt 3  # dashed
set style line 81 lt rgb "#808080" lw 0.5  # grey

set grid back linestyle 81
set border 3 back linestyle 80 # Remove border on top and right.  These
             # borders are useless and make it harder
             # to see plotted lines near the border.
    # Also, put it in grey; no need for so much emphasis on a border.
set xtics nomirror
set ytics nomirror

#set log x
#set mxtics 10    # Makes logscale look good.

# Line styles: try to pick pleasing colors, rather
# than strictly primary colors or hard-to-see colors
# like gnuplot's default yellow.  Make the lines thick
# so they're easy to see in small plots in papers.
set style line 1 lt 1
set style line 2 lt 1
set style line 3 lt 1
set style line 4 lt 1
set style line 1 lt rgb "#A00000" lw 2 pt 7
set style line 2 lt rgb "#00A000" lw 2 pt 9
set style line 3 lt rgb "#5060D0" lw 2 pt 5
set style line 4 lt rgb "#F25900" lw 2 pt 13

set output "template.svg"
set xlabel "x axis label"
set ylabel "y axis label"

set key bottom right

set xrange [0:1]
set yrange [0:1]

plot "template.dat" \
   index 0 title "Example line" w lp ls 1, \
"" index 1 title "Another example" w lp ls 2
Now here's something for which I would pay (some) real money: a gnuplot terminal which outputs directly to Keynote. Then, for example, during a presentation, one could have lines in the plot appear one at a time, explaining each without the distraction of showing irrelevant objects. This should actually be quite doable since Keynote's format is just a zipped XML.
Update 2011.04.09: Mac users of macports may note that the default install of gnuplot for some reason excludes pdfcairo. Abhinav Bhatele writes with instructions for enabling pdfcairo in macports:
$ sudo port edit gnuplot

Add these lines somewhere in the file (I added them before the lua variant):

variant pangocairo description "Enable pdfcairo" {
     depends_lib-append      port:pango
     configure.args-delete   --without-cairo
     configure.args-append   --with-cairo
}

$ sudo port info gnuplot

Just to check that pangocairo variant exists. And then:

$ sudo port uninstall gnuplot
$ sudo port install gnuplot +pangocairo

You'll need to keep in mind that if you do port selfupdate,
the edited version of the portfile might get overwritten.
Update to the update 2011.12.04: Looks like macports now includes the pangocairo variant, but still does not install it by default; so it should work if you run just the last two lines.
Update 2011.04.09: Added SVG version and made it slightly more beautiful.
Update 2013.06.21: Added fontscale 1.0 in PDF version. Also, it seems the SVG output now looks somewhat different in a more recent gnuplot ... will have to fix that sometime.
"University of Ljubljana researcher Borut Povse is conducting experiments in which a robot limb repeatedly hits human volunteers on the arm to evaluate human-robot pain thresholds in order to facilitate adherence to Isaac Asimov's first law of robotics, which prohibits robots from injuring people." [ACM TechNews]
The New York Times has a piece on public review, even to the point of crowdsourcing, as a partial alternative to peer review for scholarly publications. The interesting bit is that at least one journal, Shakespeare Quarterly, has tested this open review process. You can view the submitted papers and discussion (including a paper providing an information-theoretic analysis of Shakespeare). The interface seems well designed and allows commenting on individual paragraphs.
There are doubtless situations where this opens the reviewing process to trolls, flamewars, or inerudite remarks. On the other hand, assuming the comments are used to help inform a final judgement by experts, there could be advantages. Reviewing a paper is sometimes like an NP search problem, to find the contributions and weaknesses. Public review could be seen as using crowdsourcing to tackle the search problem. Certain comments would be easily verifiable by an expert, even without relying on the trustworthiness of the anonymous commenter, yet would not necessarily have been noticed by any particular expert. (The same easy-verification property is one reason Wikipedia is useful even when you're looking for a reliable answer to a question.)
In computer networking research, the closest we come to a collaborative, real-time form of reviewing is Computer Communication Review which has just recently started returning reviews to authors as they are submitted, and allowing authors to comment on the reviews.
Unrelated fun ... here's Seaquence, a clever visualization of musical composition.
In computer science and hacker circles, the programming language wars have, it seems, been raging since the beginning of time. A little electronic archaeology reveals some amusing exchanges:
"By all means create your own dialect of FORTH. While your at it, you can add the best features of PL-I, F77 and CORAL66. Then, look me up when you get out of college and we'll show you how it's done when you have to make a living" [1985 thread]
"This debate ... is very much like two engineers engaged in building a three-mile bridge arguing over the brand of blue-print paper they use." [1987 thread]
Passionate arguments can often be improved by actual measurements. How fast, expressive, and efficient is a particular language? That's what The Computer Language
Benchmarks Game set out to provide, measuring time, source code length, and memory use of several dozen languages across a set of benchmarks.
If you have measurements, why not improve them with a visualization? And so I present to you an interactive, multi-dimensional, dynamic, whizbang-o-matic rendering of the Programming Language Wars.






 Posts
Posts